
Ramblings about C++ and Linux's perf.
I’ve been watching some Handmade Hero as of late, a series in which Casey Muratori creates a game from about as scratch as you can get - not even using the standard C runtime library.
I can’t say I fully agree with his reluctance to use certain C++ features like templates, but the series has shown some benefits to writing your own base code instead of relying on the standard library.
Taking that to heart, I have started a small standard library of my own, with some additions and replacements for some parts of C++’s STL. I don’t plan to stop using std:: things in my code, but writing my own versions of certain bits is, if nothing else, educational.

After I found std::experimental::string_view from the draft of the next C++
version I started using it anywhere I didn’t need the mutability of std::string,
but being experimental it isn’t yet fully supported across compilers. Its
interoperability with std::string isn’t that great either, which prompted me to
start my alternate standard library - altlib
- with two classes to replace them both.
These two classes, alt::StrMut and alt::StrRef, aren’t really all that
interesting. They perform a little bit better than the std equivalents but its
nothing to write home about. The more interesting thing is a Linux tool I
discovered while debugging their performance, suitably named perf.
A lot of people say the debugging tools on Linux suck compared to other OS’s. While I agree that gdb’s interface is pretty user-unfriendly, I’ve always considered valgrind a great counterexample to that argument. Maybe I’m just tool-ignorant but I think perf is yet more proof that Linux has its fair share of awesome debugging tools.
The problem that I faced was determining why
alt::StrMut s;
for(int i = 0; i < 100000; ++i){
	s.append("some random string literal");
}
was considerably slower than doing the same thing for std::string.
So, in my search for a tool to help me I found perf, compiled a small test case,
and ran perf record on it to collect some performance data.
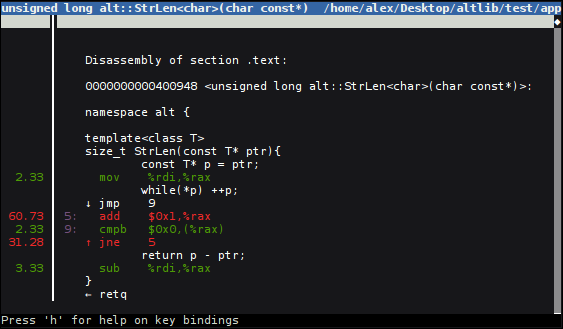
The perf tool dumps out a perf.data file, which can then be analyzed with perf
report. This was when my mind was slightly blown, as perf gives an amazing
annotated view of the assembly. As well as having neat arrows to trace the flow
of jmp instructions, it lists the hot parts of the code that are bottlenecking
the program’s performance. If you compile with debugging symbols, it intermixes
the assembly with the source code too.
I was quickly able to see the following code was the main bottleneck, in a simple strlen equivalent function:
But that seemed very odd to me, I had created the StrMut class so that its
append method took a const StrRef&, which the string literal could be implicitly
converted to with some constructors like this:
template<size_t N>
StrRef(const (&str)[N]) : length(N-1), /* [...] */

StrRef(const char* str) : length(StrLen(str)), /* [...] */
I had assumed that a string literal would bind to the first one, which gets the
literal’s length at compile time with no need for a StrLen call, but it was the
second constructor that was actually getting called.
After some searching, I found a stackoverflow answer
that seems to suggest that a string literal binds more easily to the latter
style due to the former being a template call. I’m not sure if it should really
work that way, but apparently it does. I changed the second constructor to take
a plain char* without the const to stop literals from binding to it, there’s
probably a better fix but that’ll do for the time being.
So I suppose I should thank the Handmade Hero series, for inspiring me to write code which happened to have a bug that - in turn - introduced me to perf. It will be a cool new tool in my Linux C++ debugging adventures!